Yandex Announces Second Quarter 2012 Financial Results
MOSCOW AND THE HAGUE, July 31, 2012, Yandex (NASDAQ: YNDX), the leading internet company in Russia operating the country’s most popular search engine and most visited website, today announced its unaudited financial results for the quarter ended June 30, 2012.
Q2 2012 Financial Highlights
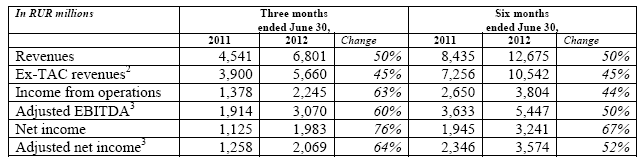
- Revenues of RUR 6.8 billion ($207.2 million1), up 50% compared with Q2 2011
Ex-TAC revenues2 (excluding traffic acquisition costs) up 45% compared with Q2 2011
- Income from operations of RUR 2.2 billion ($68.4 million), up 63% compared with Q2 2011
- Adjusted EBITDA3 of RUR 3.1 billion ($93.5 million), up 60% compared with Q2 2011
- Operating margin of 33%
Adjusted EBITDA margin2 of 45%
Adjusted ex-TAC EBITDA margin2 of 54%
- Net income of RUR 2.0 billion ($60.4 million), up 76% compared with Q2 2011
- Adjusted net income3 of RUR 2.1 billion ($63.0 million), up 64% compared with Q2 2011
- Net income margin of 29%
Adjusted net income margin2 of 30%
Adjusted ex-TAC net income margin2 of 37%
“Yandex delivered 50% growth in the top-line and expanded profitability margins in the second quarter, driven by strong advertiser dynamics, solid search share performance and overall Russian internet market leadership,” said Arkady Volozh, Chief Executive Officer of Yandex. “Technology and innovation are the foundation of our company. Along with ongoing search enhancements, we deployed important new mobile, mapping, and cloud-based services that enhance the relevance of Yandex for users and advertisers across our markets.”
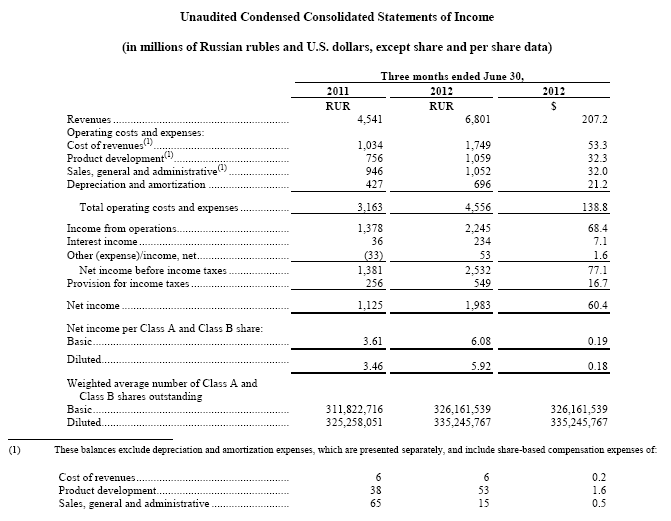
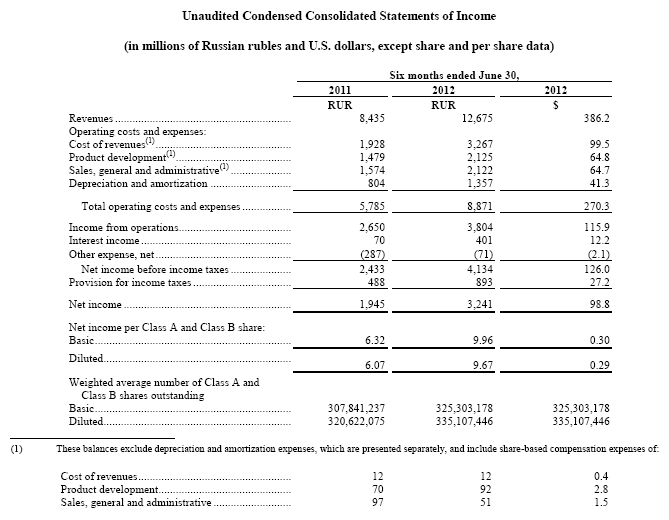
The following table provides a summary of key financial results for the three months and six months ended June 30, 2011 and 2012.
1 Pursuant to SEC rules regarding convenience translations, Russian ruble (RUR) amounts have been translated into U.S. dollars at a rate of RUR 32.8169 to $1.00, the official exchange rate quoted as of June 30, 2012 by the Central Bank of the Russian Federation.
2 This is a non-GAAP financial measure. Please see “Use of Non-GAAP Financial Measures” below for a discussion of how we define this non-GAAP financial measure. You will find a reconciliation of this non-GAAP financial measure to the most directly comparable US GAAP measure in the accompanying financial tables at the end of this release.
3 Adjusted EBITDA and adjusted net income are non-GAAP financial measures. Beginning with Q1 2012, our adjusted EBITDA and adjusted net income include adjustments for the accrual of expense related to the contingent compensation that may be payable to certain employees through November 2013 in connection with our acquisition of the mobile software business of SPB Software. Please see “Use of Non-GAAP Financial Measures” below for a discussion of how we define adjusted EBITDA and adjusted net income. You will find a reconciliation of adjusted EBITDA and adjusted net income to GAAP net income, the most directly comparable US GAAP measure for both non-GAAP measures, in the accompanying financial tables at the end of this release.
Q2 2012 Operational Highlights
- Share of Russian search market averaged 60.4% in Q2 2012 (according to LiveInternet)
- Search queries grew 30% from Q2 20114
- Number of advertisers - more than 193,000, up 34% from Q2 2011 and up 8% from Q1 2012
- Opera - renewed current agreement
- Microsoft - launched default search partnership agreement for Windows Phone in Russia, CIS and Turkey
- Turkey - the appointment of Mehmet Ali Yalçındağ as Chairman of the Board of Yandex.Turkey
4 In Q1 2012 year-on-year query growth was 34%.
Revenues

Text-based advertising revenues, accounting for 89% of total revenues in Q2 2012, continued to determine overall top-line performance.
Text-based advertising revenues from Yandex’s own websites accounted for 72% of total revenues during Q2 2012, and increased by 43% compared with Q2 2011. Text-based advertising revenues from our ad network increased 93% compared with Q2 2011 and contributed 17% of total revenues during Q2 2012.
Paid clicks on Yandex’s and its partners’ websites, in aggregate, increased 62% in Q2 2012 compared with Q2 2011. This growth in paid clicks continues to reflect our initiatives to attract new advertisers and increase the relevance of the ads on our own sites and the network. At the same time, average cost per click is 7% lower compared with Q2 2011, but up 18% compared with Q1 2012.
Display advertising revenue, accounting for 9% of total revenues during Q2 2012, increased 43% compared with Q2 2011.
Online payment commissions accounted for 2% of revenues during Q2 2012, and increased 40% compared with Q2 2011.
Operating Costs and Expenses
Yandex’s operating costs and expenses consist of cost of revenues, product development expenses, sales, general and administrative expenses (SG&A), and depreciation and amortization expenses (D&A). Apart from D&A, each of the above expense categories includes personnel-related costs and expenses, including related share-based compensation expense. Increases across all cost categories, excluding D&A, primarily reflect investments in overall growth, including personnel. In Q2 2012, Yandex added 133 full-time employees, an increase of about 4% from March 31, 2012, and up 16% from June 30, 2011. The total number of full-time employees was 3,474 as of June 30, 2012. Total share-based compensation expense decreased 32% in Q2 2012 compared with Q2 2011.
Cost of revenues, including traffic acquisition costs (TAC)

TAC increased from 16.0% of text-based revenues in Q2 2011 to 18.9% in Q2 2012, representing an increase in our Yandex ad network revenues’ share in Yandex revenues for the period.
Other cost of revenues in Q2 2012 increased 55% compared with Q2 2011, reflecting principally an increase in datacenter-related costs and utilities, personnel expenses and content acquisition costs.
Product development
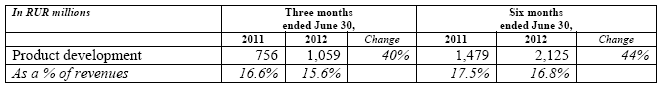
The increase in product development expenses in Q2 2012 primarily reflects an increase in personnel-related expenses due to an increase in headcount in this category from 1,626 at June 30, 2011 to 1,899 at June 30, 2012, as well as salary increases.
Selling, general and administrative (SG&A)
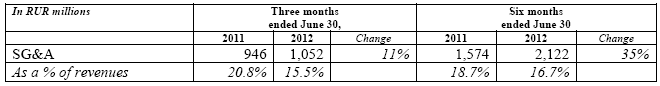
SG&A costs in Q2 2012 were considerably lower as a percentage of revenues, and increased modestly in absolute terms, compared to Q2 2011 mainly due to IPO-related expenses and higher than usual advertising costs incurred in Q2 2011.
Share-based compensation (SBC) expense
SBC expense is included in each of the cost of revenues, product development and SG&A categories discussed above.
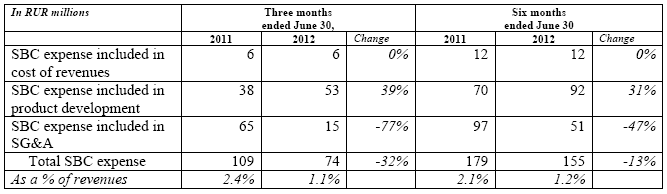
Total SBC expense decreased 32% in Q2 2012 compared with Q2 2011. The decrease is primarily related to the effects of variable accounting for certain options previously granted to advisors, included in the SG&A expense.
Depreciation and amortization (D&A) expense
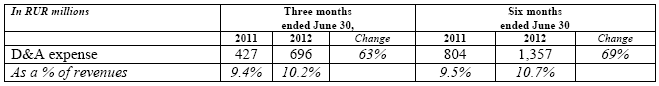
D&A expense increased 63% in Q2 2012 compared with Q2 2011, primarily reflecting our considerable recent investments in servers and data centers.
As a result of the factors described above, income from operations 2.2 billion ($68.4 million) in Q2 2012, a 63% increase from Q2 2011, while adjusted EBITDA reached RUR 3.1 billion ($93.5 million) in Q2 2012, up 60% from Q2 2011.
Interest income in Q2 2012 was RUR 234 million, up from RUR 36 million in Q2 2011, principally as a result of investing more of our cash provided by operating activities in Russia, where our investments earn higher returns. Additionally, we earned significantly more interest income in the Netherlands in Q2 2012 due to the investment of our IPO proceeds.
Foreign exchange gain in Q2 2012 was RUR 52 million, compared with a foreign exchange loss of RUR 34 million in Q2 2011. This gain is due to the appreciation of the U.S dollar during Q2 2012 from RUR 29.3282 to $1.00 on March 31, 2012 to RUR 32.8169 to $1.00 on June 30, 2012. Yandex’s Russian operating subsidiaries’ functional currency is the Russian ruble, and therefore changes in the ruble value of these subsidiaries’ monetary assets and liabilities that are denominated in other currencies (primarily U.S. dollar-denominated cash, cash equivalents and term deposits maintained in Russia) due to exchange rate fluctuations are recognized as foreign exchange gains or losses in the income statement. The U.S. dollar value of Yandex’s U.S. dollar-denominated cash, cash equivalents and term deposits was not impacted by these currency fluctuations, but they resulted in upward revaluations of the ruble equivalent of these U.S dollar-denominated monetary assets in Q2 2012.
Income tax expense for Q2 2012 was RUR 549 million, up from RUR 256 million in Q2 2011. Our effective tax rate increased from 18.5% in Q2 2011 to 21.7% in Q2 2012, but remained in-line with Q1 2012. The effective rate of Q2 2011 benefited from the effect of the change in our treasury policy following the IPO and a reversal of an accrual for dividend withholding tax made in Q1 2011 of RUR 24 million. In recent years, Yandex’s principal Russian operating subsidiary had been paying dividends to its Netherlands parent company and incurred a 5% withholding tax in Russia when these dividends were paid. Under the new treasury policy, however, management does not currently expect this Russian operating subsidiary to pay dividends to the parent company out of 2011 or 2012 earnings. Therefore, no accrual for dividend withholding tax was required for Q2 2012.
Adjusted net income in Q2 2012 was RUR 2.1 billion ($63.0 million), a 64% increase from Q2 2011. Growth in adjusted net income exceeded revenue growth primarily as a result of decreases as a percentage of revenues in SG&A and product development costs.
Adjusted net income margin was 30.4% in Q2 2012, compared with 27.7% in Q2 2011.
Net income was RUR 2.0 billion ($60.4 million) in Q2 2012, up 76% compared with Q2 2011. The higher growth in net income compared with adjusted net income was primarily the result of SBC expenses representing a smaller portion of operating costs and expenses and a foreign exchange gain versus losses when comparing Q2 2012 to Q2 2011.
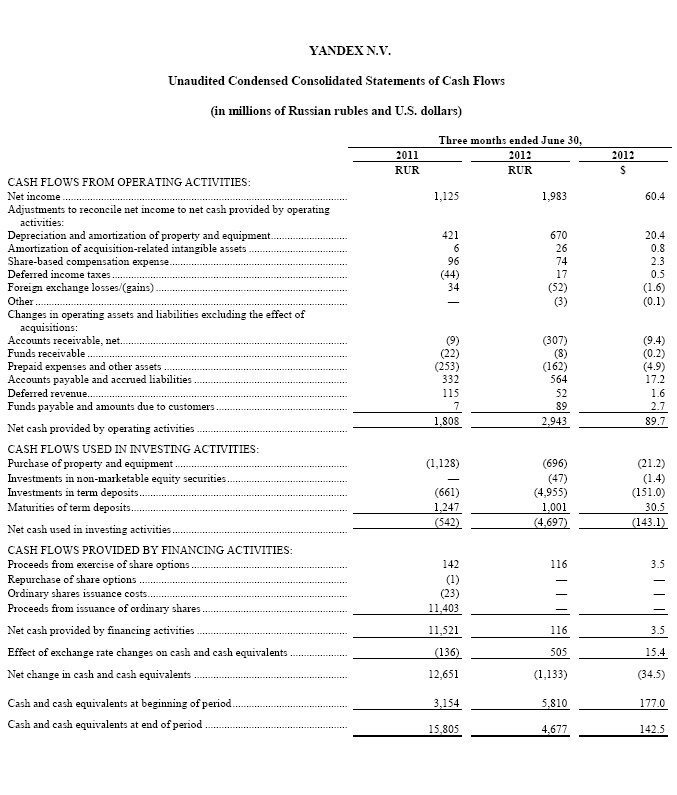
As of June 30, 2012, Yandex had cash, cash equivalents, term deposits (including long-term deposits) and long-term debt securities of RUR 24.3 billion ($741.7 million).
Net operating cash flow and capital expenditures for Q2 2012 were RUR 2.9 billion ($89.7 million) and RUR 0.7 billion ($21.2 million), respectively.
The total number of shares issued and outstanding as of June 30, 2012 was 326,429,234, including 177,989,385 Class A shares, 148,439,848 Class B shares, and one Priority share and excluding Class C shares outstanding solely as a result of conversion of Class B shares into Class A shares; all such Class C shares will be cancelled. There were also options outstanding to purchase up to an additional 11.9 million shares, at a weighted average exercise price of $4.24 per share, of which options to purchase 8.4 million shares were fully vested; and equity-settled share appreciation rights equal to 0.8 million shares, at a weighted average measurement price of $20.76, none of which were vested.
Outlook for 2012
We confirm our revenue guidance for the full year and expect year-on-year ruble-based revenue growth of 40-45%.
Conference Call Information
Yandex’s management will hold an earnings conference call on July 31, 2012 at 9:00 AM U.S. Eastern Time (5:00 PM Moscow time; 2:00 PM London time).
To access the conference call live, please dial:
US: +1 631 510 7498
UK: +44 (0) 1452 555 566
Russia: 8 10 800 20972044
Passcode: 10642656#
A replay of the call will be available until August 7, 2012. To access the replay, please dial:
US: +1 866 247 4222
Russia/International: +44 (0) 1452 550 000
Passcode: 10642656#
A live and archived webcast of this conference call will be available at http://investor.shareholder.com/media/Yandex/eventdetail.cfm?eventid=116371
ABOUT YANDEX
Yandex (NASDAQ: YNDX) is the leading internet company in Russia, operating the country’s most popular search engine and most visited website. Yandex also operates in Ukraine, Kazakhstan, Belarus and Turkey. Yandex’s mission is to answer any question internet users may have.
FORWARD-LOOKING STATEMENTS
This press release contains forward-looking statements that involve risks and uncertainties. These include statements regarding our anticipated revenues for full-year. Actual results may differ materially from the results predicted or implied by such statements, and our reported results should not be considered as an indication of future performance. The potential risks and uncertainties that could cause actual results to differ from the results predicted or implied by such statements include, among others, competitive pressures, changes in advertising patterns, changes in user preferences, changes in the legal and regulatory environment, technological developments, and our need to expend capital to accommodate the growth of the business, as well as those risks and uncertainties included under the captions “Risk Factors” and “Operating and Financial Review and Prospects” in our Annual Report on Form 20-F for the year ended December 31, 2011, which is on file with the Securities and Exchange Commission and is available on our investor relations website at http://company.yandex.com/investor_relations/sec_filing.xml and on the SEC website at www.sec.gov. Yandex undertakes no duty to update this information unless required by law.
Contacts:
Investor Relations
Dmitry Barsukov, Katya Zhukova
Phone: +7 495 739-7000
E-mail: askIR@yandex-team.ru
US Investor Contact
The Blueshirt Group, for Yandex
Alex Wellins
Phone: +1 415 217-5861
E-mail: alex@blueshirtgroup.com
Media Relations
Ochir Mandzhikov, Dina Litvinova
Phone: +7 495 739-7000
E-mail: pr@yandex-team.ru
USE OF NON-GAAP FINANCIAL MEASURES
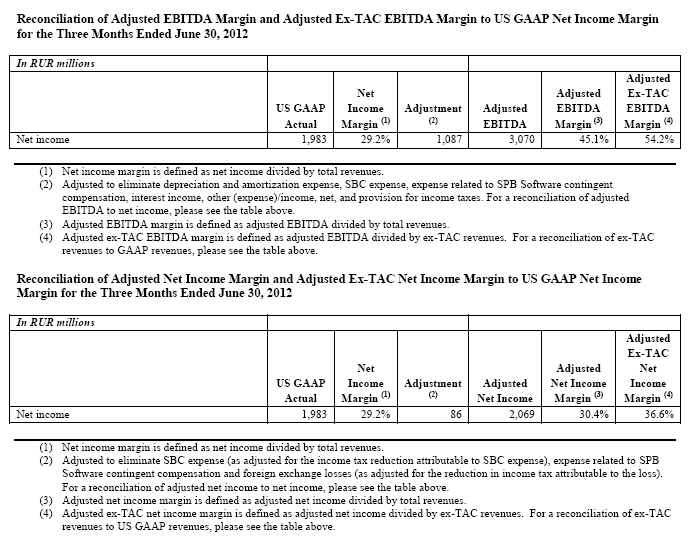
To supplement our consolidated financial statements, which are prepared and presented in accordance with US GAAP, we present the following non-GAAP financial measures: ex-TAC revenue, adjusted EBITDA, adjusted EBITDA margin, adjusted ex-TAC EBITDA margin, adjusted net income, adjusted net income margin and adjusted ex-TAC net income margin. The presentation of these financial measures is not intended to be considered in isolation or as a substitute for, or superior to, the financial information prepared and presented in accordance with US GAAP. For more information on these non-GAAP financial measures, please see the tables captioned "Reconciliations of non-GAAP financial measures to the nearest comparable US GAAP measures," included following the accompanying financial tables. We define the various non-GAAP financial measures we use as follows:
- Ex-TAC revenue means US GAAP revenues less total traffic acquisition costs (TAC).
- Adjusted EBITDA means net income plus (1) depreciation and amortization, (2) share-based compensation expense, (3) accrual of expense related to the contingent compensation that may be payable to employees in connection with our acquisition of the mobile software business of SPB Software and (4) provision for income taxes, less (A) interest income and (B) other income/(expense).
- Adjusted EBITDA margin means adjusted EBITDA divided by US GAAP revenues.
- Adjusted ex-TAC EBITDA margin means adjusted EBITDA divided by ex-TAC revenue.
- Adjusted net income means US GAAP net income plus (1) SBC expense adjusted for the income tax reduction attributable to SBC expense, (2) accrual of expense related to the contingent compensation that may be payable to certain employees in connection with our acquisition of the mobile software business of SPB Software and (3) foreign exchange losses (less foreign exchange gains) adjusted for the (reduction) increase in income tax attributable to the foreign exchange losses (gains).
- Adjusted net income margin means adjusted net income divided by ex-TAC revenues.
- Adjusted ex-TAC net income margin means adjusted net income divided by ex-TAC revenues.
These non-GAAP financial measures are used by management for evaluating financial performance as well as decision-making. Management believes that these metrics reflect the organic, core operating performance of the company, and therefore are useful to analysts and investors in providing supplemental information that helps them understand, model and forecast the evolution of our operating business. Below we describe why we make particular adjustments to certain US GAAP financial measures:
TAC
We believe that it may be useful for investors and analysts to review certain measures both in accordance with US GAAP and net of the effect of TAC, which we view as comparable to sales commissions but, unlike sales commissions, are not deducted from US GAAP revenues. By presenting revenue, adjusted EBITDA margin and adjusted net income margin net of TAC, we believe that investors and analysts are able to obtain a clearer picture of our business without the impact of the revenues we share with our partners.
SBC
SBC is a significant expense item, and an important part of our compensation and incentive programs. As it is a non-cash charge, however, and highly dependent on our share price at the time of equity award grants, we believe that it is useful for investors and analysts to see certain financial measures excluding the impact of these charges in order to obtain a clear picture of our operating performance.
Acquisition-related costs
We may incur expenses in connection with acquisitions that are not indicative of our recurring core operating performance. In particular, we are required under US GAAP to accrue as expense the contingent compensation that may be payable to certain employees in connection with our acquisition of the mobile software business of SPB Software in November 2011. The maximum aggregate amount of such contingent compensation is $14.1 million, payable on the achievement of certain milestones and the continued employment of the sellers, in two installments in November 2012 and 2013. Such maximum aggregate amount is being accrued substantially pro rata over the eight quarters of such period. We have eliminated this acquisition-related expense from adjusted EBITDA and adjusted net income to provide management and investors a tool for comparing on a period-to-period basis our operating performance in the ordinary course of operations.
Foreign exchange gains and losses
Because we hold significant assets in currencies other than our Russian ruble operating currency, and because foreign exchange fluctuations are outside of our operational control, we believe that it is useful to present adjusted net income and related margin measures excluding these effects, in order to provide greater clarity regarding our operating performance.
Although our management uses these measures for operational decision making and considers these non-GAAP financial measures to be useful for analysts and investors, we recognize that there are a number of limitations related to such measures. In particular, it should be noted that several of these measures exclude some costs, particularly share-based compensation, that are recurring. In addition, the components of the costs that we exclude in our calculation of the measures described above may differ from the components that our peer companies exclude when they report their results of operations.
The tables at the end of this release provide detailed reconciliations of each non-GAAP financial measure we use to the most directly comparable US GAAP financial measure.


Contact:
Media Relations
Vladimir Isaev, Ochir Mandzhikov
Phone: +7 495 739-7000
E-mail: pr@yandex-team.com

 Download