Yandex Announces First Quarter 2012 Financial Results
MOSCOW AND THE HAGUE, April 26, 2012, Yandex (NASDAQ: YNDX), the leading internet company in Russia operating the country’s most popular search engine and most visited website, today announced its unaudited financial results for the quarter ended March 31, 2012.
Q1 2012 Financial Highlights
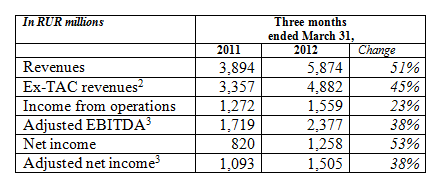
- Revenues of RUR 5.9 billion ($200.3 million1), up 51% compared with Q1 2011
Ex-TAC revenues2 (excluding traffic acquisition costs) up 45% compared with Q1 2011
- Income from operations of RUR 1.6 billion ($53.2 million), up 23% compared with Q1 2011
- Adjusted EBITDA3 of RUR 2.4 billion ($81.0 million), up 38% compared with Q1 2011
- Operating margin of 26.5%
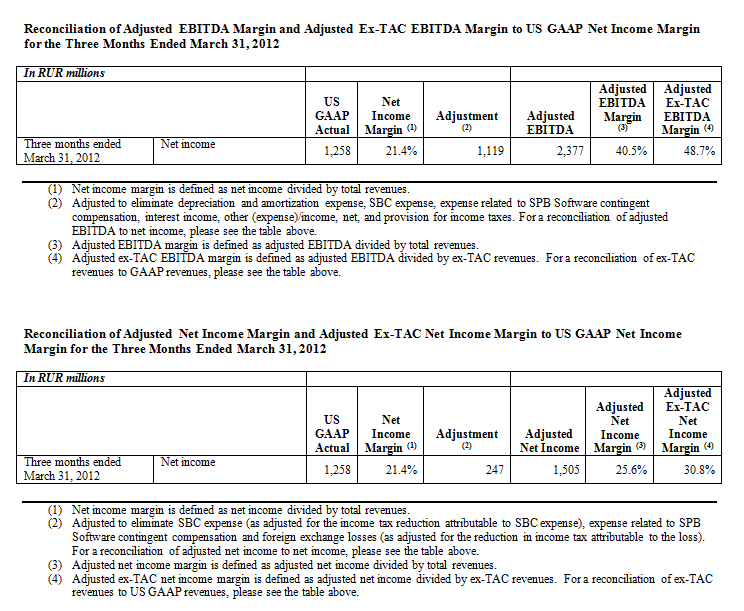
Adjusted EBITDA margin2 of 40.5%
Adjusted ex-TAC EBITDA margin2 of 48.7%
- Net income of RUR 1.3 billion ($42.9 million), up 53% compared with Q1 2011
- Adjusted net income3 of RUR 1.5 billion ($51.3 million), up 38% compared with Q1 2011
- Net income margin of 21.4%
Adjusted net income margin2 of 25.6%
Adjusted ex-TAC net income margin2 of 30.8%
“Yandex drove another strong quarter of robust growth, highlighted by particularly strong contextual advertising results as well as ongoing market and search share leadership,” said Arkady Volozh, Chief Executive Officer of Yandex. “We continued to focus on our core search product, emphasizing the integration of social media and improving the freshness of our search results to enhance user experience. We launched important new map-based services and are developing Yandex’s presence across the entire spectrum of mobile devices.”
The following table provides a summary of key financial results for the three months ended March 31, 2011 and 2012.
1 Pursuant to SEC rules regarding convenience translations, Russian ruble (RUR) amounts have been translated into U.S. dollars at a rate of RUR 29.3282 to $1.00, the official exchange rate quoted as of March 31, 2012 by the Central Bank of the Russian Federation.
2 This is a non-GAAP financial measure. Please see “Use of Non-GAAP Financial Measures” below for a discussion of how we define this non-GAAP financial measure. You will find a reconciliation of this non-GAAP financial measure to the most directly comparable US GAAP measure in the accompanying financial tables at the end of this release.
3 Adjusted EBITDA and adjusted net income are non-GAAP financial measures. Beginning with Q1 2012, our adjusted EBITDA and adjusted net income include adjustments for the accrual of expense related to the contingent compensation that may be payable to certain employees through November 2013 in connection with our acquisition of the mobile software business of SPB Software. Please see “Use of Non-GAAP Financial Measures” below for a discussion of how we define adjusted EBITDA and adjusted net income. You will find a reconciliation of adjusted EBITDA and adjusted net income to GAAP net income, the most directly comparable US GAAP measure for both non-GAAP measures, in the accompanying financial tables at the end of this release.
Q1 2012 Operational Highlights
- Share of Russian search market averaged 59.4% in Q1 2012 (according to LiveInternet)
- SERPs (search engine result pages) grew 36% from Q1 2011
- Number of advertisers was more than 179,000, up 40% from Q1 2011 and up 3% from Q4 2011
- Average Daily Visitors in Turkey was more than 390,000 in March, up almost twice from 200,000 in January (according to comScore)
- Extended social search program, partnership with Twitter making tweets available in Yandex's Blog Search
- Launched Yandex Navigator for iOS and Android; Yandex.Shell for Android
- Implemented Real-Time Bidding (RTB) technology for display advertising
Revenues

Text-based advertising revenues, accounting for 90% of total revenues in Q1 2012, continued to determine overall top-line performance.
Text-based advertising revenues from Yandex’s own websites accounted for 73% of total revenues during Q1 2012, and increased by 43% compared with Q1 2011. Text-based advertising revenues from our ad network increased 117% compared with Q1 2011 and contributed 17% of total revenues during Q1 2012. The enhanced performance of our Yandex ad network reflects the addition of Rambler to our ad network in mid-2011 as well as improved monetization from our contextual partner network sites due to improvements in our advertising technology.
Paid clicks on Yandex’s and its partners’ websites, in aggregate, increased 61% in Q1 2012 compared with Q1 2011. This growth in paid clicks reflects our initiatives to attract new advertisers and increase the relevance of the ads on our own sites and the network. At the same time, reflecting increased affordability and efficiency of ad spend on Yandex, average cost per click decreased 5% compared with Q1 2011, making our platform more attractive to advertisers.
Display advertising revenue, accounting for 7% of total revenues during Q1 2012, increased 28% compared with Q1 2011, demonstrating significant growth over a strong Q1 2011.
Online payment commissions accounted for 2% of revenues during Q1 2012, and increased 39% compared with Q1 2011.
Operating Costs and Expenses
Yandex’s operating costs and expenses consist of cost of revenues, product development expenses, sales, general and administrative expenses (SG&A), and depreciation and amortization expenses (D&A). Apart from D&A, each of the above expense categories includes personnel-related costs and expenses, including related share-based compensation expense. Increases across all cost categories, excluding D&A, reflect investments in overall growth, including personnel. In Q1 2012, Yandex added 29 full-time employees, an increase of less than 1% from December 31, 2011, and up 25% from March 31, 2011. The total number of full-time employees was 3,341 as of March 31, 2012. Total share-based compensation expense increased 16% in Q1 2012 compared with Q1 2011.
Cost of revenues, including traffic acquisition costs (TAC)
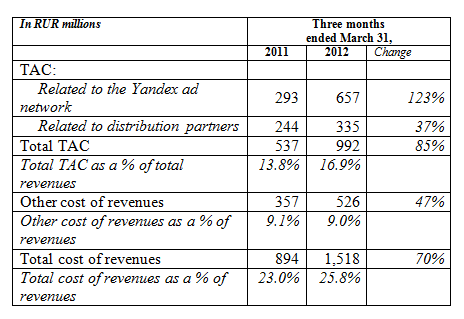
TAC increased from 15.5% of text-based revenues in Q1 2011 to 18.7% in Q1 2012, representing our Yandex ad network partners’ share in an increased amount of Yandex ad network revenue for the period.
Other cost of revenues in Q1 2012 increased 47% compared with Q1 2011, reflecting principally an increase in datacenter-related costs and utilities, personnel expenses and content acquisition costs.
Product development

The increase in product development expenses in Q1 2012 primarily reflects the increase in personnel-related expenses.
Selling, general and administrative (SG&A)

The increase in SG&A in Q1 2011 was driven primarily by increased personnel-related costs, as well as increased advertising and marketing expenses due to the timing of campaigns and expenses related to office rent and utilities.
Share-based compensation (SBC) expense
SBC expense is included in each of the cost of revenues, product development and SG&A categories discussed above.

Total SBC expense increased 16% in Q1 2012 compared with Q1 2011. The increase is primarily related to share-based compensation on share appreciation rights granted to employees in 2011, which had fair values significantly higher than previous equity-based awards.
Depreciation and amortization (D&A) expense

D&A expense increased 75% in Q1 2012 compared with Q1 2011, primarily reflecting our considerable recent investments in servers and data centers.
As a result of the factors described above, income from operations was RUR 1.6 billion ($53.2 million) in Q1 2012, a 23% increase from Q1 2011, while adjusted EBITDA reached RUR 2.4 billion ($81.0 million) in Q1 2012, up 38% from Q1 2011.
Interest income in Q1 2012 was RUR 167 million, up from RUR 34 million in Q1 2011, principally as a result of investing more of our cash provided by operating activities in Russia, where our investments earn higher returns. Additionally, we earned significantly more interest income in the Netherlands due to the investment of our IPO proceeds.
Foreign exchange loss in Q1 2012 was RUR 114 million, compared to a foreign exchange loss of RUR 254 million in Q1 2011. This loss is due to the depreciation of the U.S. dollar during Q1 2012 from RUR 32.1961 to $1.00 on December 31, 2011 to RUR 29.3282 to $1.00 on March 31, 2012. Yandex’s Russian operating subsidiaries’ functional currency is the Russian ruble, and therefore changes in the ruble value of these subsidiaries’ monetary assets and liabilities that are denominated in other currencies (primarily U.S. dollar-denominated cash, cash equivalents and term deposits maintained in Russia) due to exchange rate fluctuations are recognized as foreign exchange gains or losses in the income statement. The U.S. dollar value of Yandex’s U.S. dollar-denominated cash, cash equivalents and term deposits was not impacted by these currency fluctuations, but they resulted in downward revaluations of the ruble equivalent of these U.S. dollar-denominated monetary assets in both Q1 2012 and Q1 2011.
Income tax expense for Q1 2012 was RUR 344 million, up from RUR 232 million in Q1 2011. Our effective tax rate decreased from 22.1% in Q1 2011 to 21.5% in Q1 2012, primarily reflecting a change in our treasury policy following the IPO in Q2 2011. In recent years, Yandex’s principal Russian operating subsidiary had been paying dividends to its Netherlands parent company and incurred a 5% withholding tax in Russia when these dividends were paid. Under the new treasury policy, however, management does not currently expect this Russian operating subsidiary to pay dividends to the parent company out of 2011 or 2012 earnings. Therefore, no accrual for dividend withholding tax was required for Q1 2012.
Adjusted net income in Q1 2012 was RUR 1.5 billion ($51.3 million), a 38% increase from Q1 2011, broadly in line with the underlying operating results. It was positively impacted by a change in the effective income tax rate resulting from the elimination of the dividend withholding tax accrual.
Adjusted net income margin was 25.6% in Q1 2012, compared to 28.1% in Q1 2011.
Net income was RUR 1.3 billion ($42.9 million) in Q1 2012, up 53% compared with Q1 2011. The higher growth in net income compared with adjusted net income was primarily the result of SBC expenses representing a smaller portion of other operating costs and expenses and a decrease in foreign exchange losses when comparing Q1 2012 to Q1 2011.
As of March 31, 2012, Yandex had cash, cash equivalents, term deposits (including long-term deposits) and long-term debt securities of RUR 20.6 billion ($703.6 million).
Net operating cash flow and capital expenditures for Q1 2012 were RUR 1.8 billion ($62.3 million) and RUR 0.8 billion ($26.2 million), respectively.
The total number of shares issued and outstanding as of March 31, 2012 was 325,547,254, including 167,726,170 Class A shares, 157,821,083 Class B shares, and one Priority share and excluding Class C shares outstanding solely as a result of conversion of Class B shares into Class A shares; all such Class C shares will be cancelled. There were also options outstanding to purchase up to an additional 12.8 million shares, at a weighted average exercise price of $4.20 per share, of which options to purchase 8.7 million shares were fully vested; and equity-settled share appreciation rights equal to 0.8 million shares, at a weighted average measurement price of $20.77, none of which were vested.
Outlook for 2012
We reaffirm our revenue guidance for the full-year 2012, and continue to expect year-on-year ruble-based revenue growth of 40-45%.
Conference Call Information
Yandex’s management will hold an earnings conference call on April 26, 2012 at 9:00 AM U.S. Eastern Time (5:00 PM Moscow time; 2:00 PM London time).
To access the conference call live, please dial:
US: +1 877 391 1148
UK: +44 (0) 1452 580 733
Russia: 8 10 800 25652044
Passcode: 70778147#
A replay of the call will be available until May 3, 2012. To access the replay, please dial:
US: +1 866 247 4222
Russia/International: +44 (0) 1452 550 000
Passcode: 70778147#
A live and archived webcast of this conference call will be available at http://investor.shareholder.com/media/Yandex/eventdetail.cfm?eventid=111969
ABOUT YANDEX
Yandex (NASDAQ: YNDX) is the leading internet company in Russia, operating the country’s most popular search engine and most visited website. Yandex also operates in Ukraine, Kazakhstan, Belarus and Turkey. Yandex’s mission is to answer any question internet users may have.
FORWARD-LOOKING STATEMENTS
This press release contains forward-looking statements that involve risks and uncertainties. These include statements regarding the planned growth of our business, our anticipated revenues for full-year 2012 and our product development efforts. Actual results may differ materially from the results predicted or implied by such statements, and our reported results should not be considered as an indication of future performance. The potential risks and uncertainties that could cause actual results to differ from the results predicted or implied by such statements include, among others, competitive pressures, changes in advertising patterns, changes in user preferences, changes in the legal and regulatory environment, technological developments, unforeseen changes in our hiring patterns, and our need to expend capital to accommodate the growth of the business, as well as those risks and uncertainties included under the captions “Risk Factors” and “Operating and Financial Review and Prospects” in our Annual Report on Form 20-F for the year ended December 31, 2011, which is on file with the Securities and Exchange Commission and is available on our investor relations website at http://company.yandex.com/investor_relations/sec_filing.xml and on the SEC website at www.sec.gov. All information provided in this release and in the attachments is as of April 26, 2012, and Yandex undertakes no duty to update this information unless required by law.
Contacts:
Investor Relations
Dmitry Barsukov, Katya Zhukova
Phone: +7 495 739-7000
E-mail: askIR@yandex-team.ru
US Investor Contact
The Blueshirt Group, for Yandex
Alex Wellins
Phone: +1 415 217-5861
E-mail: alex@blueshirtgroup.com
Media Relations
Ochir Mandzhikov, Dina Litvinova
Phone: +7 495 739-7000
E-mail: pr@yandex-team.ru
USE OF NON-GAAP FINANCIAL MEASURES
To supplement our consolidated financial statements, which are prepared and presented in accordance with US GAAP, we present the following non-GAAP financial measures: ex-TAC revenue, adjusted EBITDA, adjusted EBITDA margin, adjusted ex-TAC EBITDA margin, adjusted net income, adjusted net income margin and adjusted ex-TAC net income margin. The presentation of these financial measures is not intended to be considered in isolation or as a substitute for, or superior to, the financial information prepared and presented in accordance with US GAAP. For more information on these non-GAAP financial measures, please see the tables captioned "Reconciliations of non-GAAP financial measures to the nearest comparable US GAAP measures," included following the accompanying financial tables. We define the various non-GAAP financial measures we use as follows:
- Ex-TAC revenue means US GAAP revenues less total traffic acquisition costs (TAC).
- Adjusted EBITDA means net income plus (1) depreciation and amortization, (2) share-based compensation expense, (3) accrual of expense related to the contingent compensation that may be payable to employees in connection with our acquisition of the mobile software business of SPB Software and (4) provision for income taxes, less (A) interest income and (B) other income/(expense).
- Adjusted EBITDA margin means adjusted EBITDA divided by US GAAP revenues.
- Adjusted ex-TAC EBITDA margin means adjusted EBITDA divided by ex-TAC revenue.
- Adjusted net income means US GAAP net income plus (1) SBC expense adjusted for the income tax reduction attributable to SBC expense, (2) accrual of expense related to the contingent compensation that may be payable to certain employees in connection with our acquisition of the mobile software business of SPB Software and (3) foreign exchange losses (less foreign exchange gains) adjusted for the (reduction) increase in income tax attributable to the foreign exchange losses (gains).
- Adjusted net income margin means adjusted net income divided by US GAAP revenues.
- Adjusted ex-TAC net income margin means adjusted net income divided by ex-TAC revenues.
These non-GAAP financial measures are used by management for evaluating financial performance as well as decision-making. Management believes that these metrics reflect the organic, core operating performance of the company, and therefore are useful to analysts and investors in providing supplemental information that helps them understand, model and forecast the evolution of our operating business.
In particular, we believe that it may be useful for investors and analysts to review certain measures both in accordance with US GAAP and net of the effect of TAC, which we view as comparable to sales commissions but, unlike sales commissions, are not deducted from US GAAP revenues. By presenting revenue, adjusted EBITDA margin and adjusted net income margin net of TAC, we believe that investors and analysts are able to obtain a clearer picture of our business without the impact of the revenues we share with our partners. In addition, SBC is a significant expense item, and an important part of our compensation and incentive programs. As it is a non-cash charge, however, and highly dependent on our share price at the time of equity award grants, we believe that it is useful for investors and analysts to see certain financial measures excluding the impact of these charges in order to obtain a clear picture of our operating performance. Further the Company may incur expenses in connection with acquisitions that are not indicative of its recurring core operating performance. In particular, we are required under US GAAP to accrue as expense the contingent compensation that may be payable to certain employees in connection with our acquisition of the mobile software business of SPB Software in November 2011. The maximum aggregate amount of such contingent compensation is $14.1 million, payable on the achievement of certain milestones and the continued employment of the sellers, in two installments in November 2012 and 2013. Such maximum aggregate amount is being accrued substantially pro rata over the eight quarters of such period. We have eliminated this acquisition-related expense from adjusted EBITDA and adjusted net income to provide management and investors a tool for comparing on a period-to-period basis our operating performance in the ordinary course of operations. Finally, as we hold significant assets in currencies other than our Russian ruble operating currency, and as foreign exchange fluctuations are outside of our operational control, we believe that it is useful to present adjusted net income and related margin measures excluding these effects, in order to provide greater clarity regarding our operating performance.
Although our management uses these measures for operational decision making and considers these non-GAAP financial measures to be useful for analysts and investors, we recognize that there are a number of limitations related to such measures. In particular, it should be noted that several of these measures exclude some costs, particularly share-based compensation, that are recurring. In addition, the components of the costs that we exclude in our calculation of the measures described above may differ from the components that our peer companies exclude when they report their results of operations.
The tables at the end of this release provide detailed reconciliations of each non-GAAP financial measure we use to the most directly comparable US GAAP financial measure.


Contact:
Media Relations
Vladimir Isaev, Ochir Mandzhikov
Phone: +7 495 739-7000
E-mail: pr@yandex-team.com

 Download