Yandex Announces Second Quarter 2011 Financial Results
MOSCOW AND THE HAGUE, July 28, 2011, Yandex (NASDAQ: YNDX), the leading internet company in Russia operating the country’s most popular search engine and most visited website, today announced its unaudited financial results for the quarter ended June 30, 2011.
Q2 2011 Financial Highlights
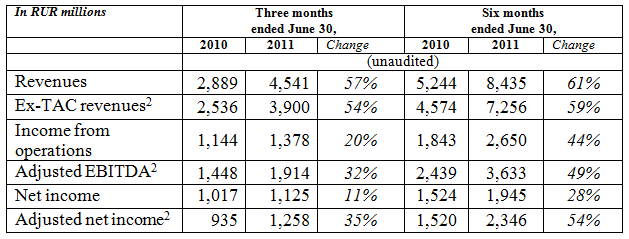
- Revenues of RUR 4.5 billion ($161.7 million1), up 57% compared with Q2 2010
Ex-TAC revenues2 (excluding traffic acquisition costs) up 54% compared with Q2 2010
- Income from operations of RUR 1.4 billion ($49.1 million), up 20% compared with Q2 2010
- Adjusted EBITDA2 of RUR 1.9 billion ($68.2 million), up 32% compared with Q2 2010
- Operating margin of 30.3%
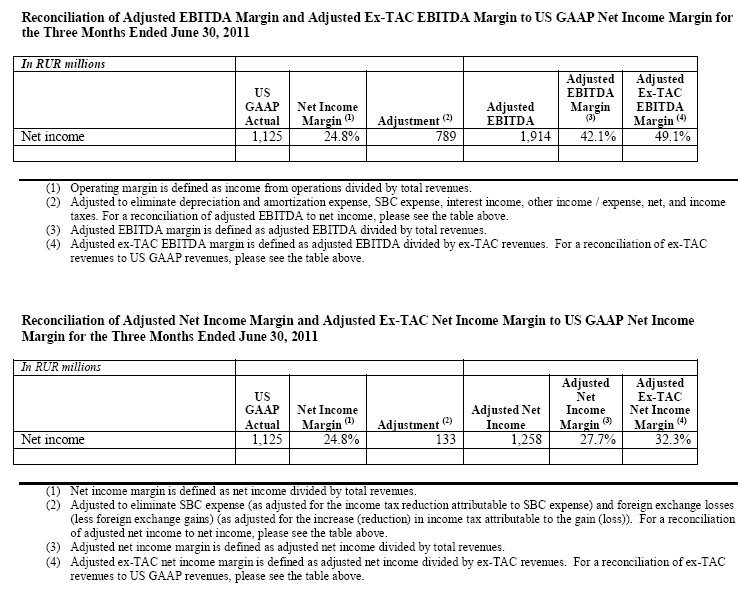
Adjusted EBITDA margin2 of 42.1%
Adjusted ex-TAC EBITDA margin2 of 49.1%
- Net income of RUR 1.1 billion ($40.1 million), up 11% compared with Q2 2010
Adjusted net income2 of RUR 1.3 billion ($44.8 million), up 35% compared with Q2 2010
- Net income margin of 24.8%
Adjusted net income margin2 of 27.7%
Adjusted ex-TAC net income margin2 of 32.3%
“Yandex drove strong execution in the second quarter while completing its IPO on the Nasdaq Global Select Market. We delivered solid growth across our key financial and business metrics while continuing to invest in talent, facilities and content to support the next planned phase of our growth,” said Arkady Volozh, Chief Executive Officer of Yandex. “Our success continued against the backdrop of further robust growth of the Russian internet market. We maintained our leadership position, allowing us to continue to accelerate revenue growth and secure important search partnerships with key strategic players.”
The following table provides a summary of key financial results for the three and six months ended June 30, 2010 and 2011:
1 Pursuant to SEC rules regarding convenience translations, Russian ruble (RUR) amounts have been translated into U.S. dollars at a rate of RUR 28.0758 to $1.00, the official exchange rate quoted as of June 30, 2011 by the Central Bank of the Russian Federation.
2 This is a non-GAAP financial measure. Please see “Use of Non-GAAP Financial Measures” below for a discussion of how we define this non-GAAP financial measure. You will find a reconciliation of this non-GAAP financial measure to the most directly comparable US GAAP measure in the accompanying financial tables at the end of this release.
Q2 2011 Operational Highlights
- Share of Russian search market was 64.6% for Q2 2011 (according to LiveInternet)
- SERPs (search engine result pages) grew 60% from Q2 2010
- Number of advertisers was more than 144,000, up 41% from Q2 2010 and up 13% from Q1 2011
- Launched a partnership with Rambler, one of Russia’s top four search destinations and a leading internet portal, to power its search and serve advertising on its sites
- Launched Yandex.Factory, an initiative to provide seed financing to support startups and independent teams of developers, and made initial investments
- Continued focusing on mobile products and services, rolling out several new initiatives including mobile SERP, Yandex.Mail for i-Phone and Yandex.Panorama for a variety of mobile platforms
- Implemented machine learning technologies on Yandex.Market, the Company’s comparison shopping service
Revenues

Text-based advertising revenues, accounting for 88% of total revenues in Q2 2011, continued to determine overall top-line performance.
Text-based advertising revenues from Yandex’s own websites, accounting for 75% of total revenues during Q2 2011, increased 57% compared with Q2 2010, while these revenues on its ad network, accounting for 13% of total revenues during Q2 2011, increased 69% compared with Q2 2010.
Paid clicks on Yandex’s and its partners’ websites, in aggregate, increased 47% in Q2 2011 compared with Q2 2010, while the average cost per click increased 8% during the same period.
Display advertising revenue, accounting for 10% of total revenues during Q2 2011, increased 50% compared with Q2 2010.
Online payment commissions, excluding intercompany revenue from commissions charged for payments for advertising on Yandex’s sites, accounted for 2% of revenue during Q2 2011, an increase of 52% compared with Q2 2010.
Operating Costs and Expenses
Yandex’s operating costs and expenses consist of cost of revenues, product development expenses, sales, general and administrative expenses (SG&A), and depreciation and amortization expenses (D&A). Each of the above expense categories includes personnel-related costs and expenses, including related share-based compensation expense. Increases across all cost categories, except D&A, reflect aggressive investments in overall growth, particularly in talent. Full-time employees increased to 3,001 at June 30, 2011, up 12% from March 31, 2011, and up 54% from June 30, 2010. Additionally, year-on-year growth in SG&A in Q2 was affected by the costs associated with our IPO, as well as an outdoor advertising campaign. Total share-based compensation expense increased 241% in Q2 2011, with the most pronounced increase in the SG&A category, as detailed below.
Costs of revenues, including traffic acquisition costs (TAC)

TAC increased to 16% of text-based revenues in Q2 2011, reflecting faster growth of the ad network as well as increased traffic to Yandex’s own sites through distribution partners.
Other cost of revenues in Q2 2011 increased 69% compared with Q2 2010, reflecting an increase in datacenter-related costs and utilities, as well as content acquisition costs. The number of people employed in the departments allocated to costs of revenues increased 36%, from 211 as of June 30, 2010, to 288 as of June 30, 2011.
Product development

The increase in product development expenses in Q2 2011 primarily reflects the increase in personnel-related expense. Headcount in development staff increased 58% from 1,030 as of June 30, 2010, to 1,626 as of June 30, 2011.
Selling, general and administrative (SG&A)

The increase in SG&A in Q2 2011 was driven primarily by increased personnel-related costs. Additionally, the spillover IPO costs of 65 million rubles (in excess of the amount reimbursed by the underwriters), as well as the expenses of an outdoor advertising campaign, contributed to the significant increase from Q2 2010. Headcount in departments whose costs are allocated to SG&A expenses increased 54%, from 707 as of June 30, 2010, to 1,087 as of June 30, 2011.
Share-based compensation (SBC) expense
SBC expense is included in each of the cost of revenues, product development and SG&A categories discussed above.

Total SBC expense increased 241% in Q2 2011 compared with Q2 2010, with the most pronounced increase in the SG&A category. This increase was primarily driven by a post-IPO modification to the terms of an option previously granted to a departing employee, as well as mark-to-market adjustments related to non-employee grants and certain share-based awards accounted for as liabilities.
Depreciation and amortization (D&A) expense

D&A expense increased 57% in Q2 2011 compared with Q2 2010, primarily reflecting previous-period investments in servers and data centers.
As a result of the movements described above, income from operations was RUR 1.4 billion ($49.1 million) in Q2 2011, a 20% increase from Q2 2010, while adjusted EBITDA reached RUR 1.9 billion ($68.2 million) in Q2 2011, up 32% from Q2 2010.
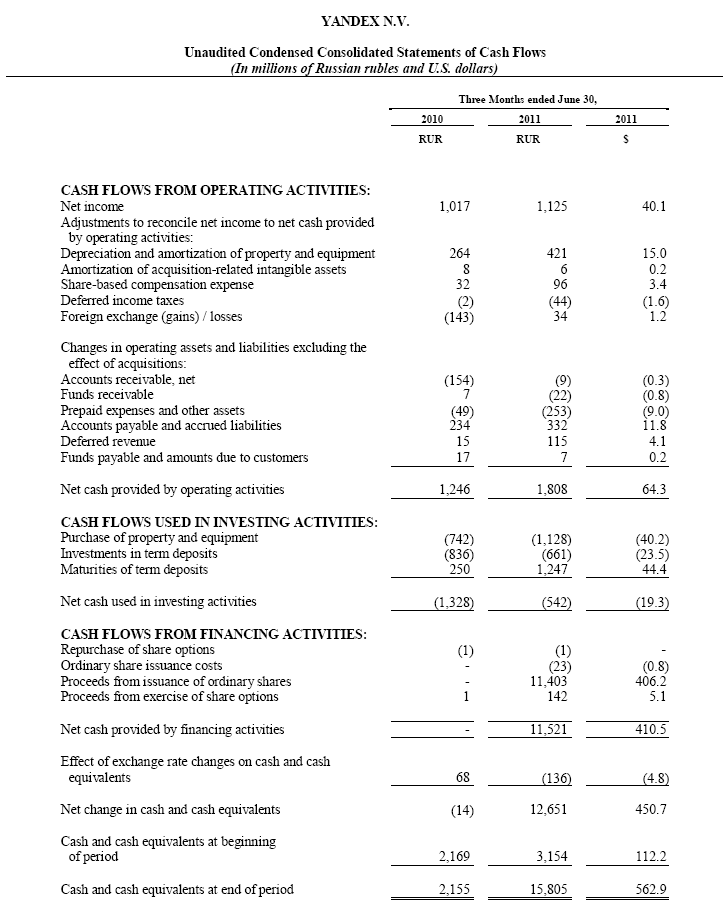
Interest income in Q2 2011 was RUR 36 million, down from RUR 39 million in Q2 2010, reflecting lower effective interest rates notwithstanding the proceeds received from the IPO.
Foreign exchange loss in Q2 2011 was RUR 34 million. This loss is due to the depreciation of the U.S dollar during Q2 2011 from RUR 28.4290 to $1.00 on March 31, 2011 to RUR 28.0758 to $1.00 on June 30, 2011. This compares to a foreign exchange gain of RUR 143 million in Q2 2010, as the U.S. dollar appreciated from RUR 29.3638 to $1.00 on March 31, 2010 to RUR 31.1954 to $1.00 on June 30, 2010. Because the functional currency of Yandex’s operating subsidiaries in Russia is the Russian ruble, changes in the ruble value of these subsidiaries’ monetary assets and liabilities that are denominated in other currencies (primarily U.S. dollar-denominated cash, cash equivalents and term deposits maintained in Russia) due to exchange rate fluctuations are recognized as foreign exchange gains or losses in our income statement. Although the U.S. dollar value of Yandex’s U.S. dollar-denominated cash, cash equivalents and term deposits was not impacted by these currency fluctuations, they resulted in downward and upward revaluations, respectively, of the ruble equivalent of these U.S dollar-denominated monetary assets.
Income tax expense for Q2 2011 was RUR 256 million, down from RUR 309 million in Q2 2010, primarily reflecting a change in our treasury plans following our IPO. In recent years, Yandex’s principal Russian operating subsidiary had been paying dividends to the Netherlands parent company. Management does not, however, currently expect our Russian operating subsidiary to pay dividends to the parent company out of 2011 earnings. Therefore no accrual for dividend withholding tax was required for Q2 and the Company made a reversal of 24 million rubles of the accrual made in Q1 2011.
Adjusted net income in Q2 2011 was RUR 1.3 billion ($44.8 million), a 35% increase from Q2 2010. It was positively impacted by a change in the effective income tax rate resulting from no accrual of withholding tax and the reversal of the Q1 2011 withholding tax charge. Adjusted net income margin was 27.7% in Q2 2011 compared to 32.4% in Q2 2010.
Net income was RUR 1.1 billion ($40.1 million) in Q2 2011, up 11% compared with Q2 2010, significantly lower than growth in adjusted net income. In addition to the factors described above, net income reflects the combined effect of a foreign exchange loss in Q2 2011 compared with a gain in Q2 2010 (as discussed in more detail above).
As of June 30, 2011, Yandex had cash, cash equivalents and term deposits (including long-term deposits) of RUR 18.8 billion ($668.0 million).
Net operating cash inflow and capital expenditures for Q2 2011 were RUR 1.8 billion ($64.3 million) and RUR 1.1 billion ($40.2 million), respectively.
The total number of shares issued and outstanding on June 30, 2011 was 322,990,652, including 132,905,988 Class A shares, 190,084,663 Class B shares, and one Priority share. There were also options outstanding to purchase up to an additional 15.7 million shares, at a weighted average exercise price of $4.19 per share, of which options to purchase 9.2 million shares were fully vested.
Outlook for the Full Year 2011
Yandex currently expects to achieve ruble based revenue growth of 55%-60% for the full year 2011. Capital expenditures in 2011 are expected to be up to RUR 6.3 billion.
Conference Call Information
Yandex’s management will hold an earnings conference call at 9:00 AM on July 28, 2011 U.S. Eastern Daylight Time (5:00 PM Moscow time; 2:00 PM London time).
To access the conference call live, please dial:
US: +1 631 510 7498
UK: +44 (0) 1452 555 566
Russia: 8 10 800 20972044
Passcode: 83829634#
A replay of the call will be available through August 4, 2011. To access the replay, please dial:
US: +1 866 247 4222
Russia/International: +44 (0) 1452 550 000
Passcode: 83829634#
A live and archived webcast of this conference call will be available at http://company.yandex.com/investor_relations/financial_releases/
ABOUT YANDEX
Yandex (NASDAQ: YNDX) is the leading internet company in Russia, operating the country’s most popular search engine and the most visited website. According to LiveInternet, in the second quarter of 2011 Yandex generated 64.6% of all search traffic in Russia. Yandex also operates in Ukraine, Kazakhstan and Belarus. Yandex’s mission is to answer any question internet users may have.
FORWARD-LOOKING STATEMENTS
This press release contains forward-looking statements that involve risks and uncertainties. These include statements regarding the planned growth of our business and our anticipated revenue and capital expenditures for full-year 2011. Actual results may differ materially from the results predicted or implied by such statements, and our reported results should not be considered as an indication of future performance. The potential risks and uncertainties that could cause actual results to differ from the results predicted or implied by such statements include, among others, competitive pressures, changes in advertising patterns, changes in the legal and regulatory environment, technological developments, unforeseen changes in our hiring patterns, and our need to expend capital to accommodate the growth of the business, as well as those risks and uncertainties included under the captions “Risk Factors” and “Management’s Discussion and Analysis of Financial Condition and Results of Operations” in our Prospectus dated May 24, 2011, which is on file with the Securities and Exchange Commission and is available on our investor relations website at http://company.yandex.com/investor_relations/sec_filing.xml and on the SEC website at www.sec.gov. All information provided in this release and in the attachments is as of July 28, 2011, and Yandex undertakes no duty to update this information unless required by law.
Contacts:
Investor Relations
Dmitry Barsukov, Katya Zhukova
Phone: +7 495 739-70-00
Fax: +7 495 739-70-70
E-mail: askIR@yandex-team.ru
Press Service
Ochir Mandzhikov, Dina Litvinova
Phone: +7 495 739-70-00
Fax: +7 495 739-70-70
E-mail: pr@yandex-team.ru
USE OF NON-GAAP FINANCIAL MEASURES
To supplement our consolidated financial statements, which are prepared and presented in accordance with US GAAP, we present the following non-GAAP financial measures: ex-TAC revenue, adjusted EBITDA, adjusted EBITDA margin, adjusted ex-TAC EBITDA margin, adjusted net income, adjusted net income margin and adjusted ex-TAC net income margin. The presentation of these financial measures is not intended to be considered in isolation or as a substitute for, or superior to, the financial information prepared and presented in accordance with US GAAP. For more information on these non-GAAP financial measures, please see the tables captioned "Reconciliations of non-GAAP financial measures to the nearest comparable US GAAP measures," included following the accompanying financial tables. We define the various non-GAAP financial measures we use as follows:
- Ex-TAC revenue means US GAAP revenues less total traffic acquisition costs (TAC).
- Adjusted EBITDA means net income plus (1) depreciation and amortization, (2) share-based compensation expense and (3) provision for income taxes, and less 1) interest income and 2) other income/(expense).
- Adjusted EBITDA margin means adjusted EBITDA divided by US GAAP revenues.
- Adjusted ex-TAC EBITDA margin means adjusted EBITDA divided by ex-TAC revenue.
- Adjusted net income means US GAAP net income plus (1) SBC expense adjusted for the income tax reduction attributable to SBC expense and (2) foreign exchange losses (less foreign exchange gains) adjusted for the increase (reduction) in income tax attributable to the foreign exchange gain (loss).
- Adjusted net income margin means adjusted net income divided by US GAAP revenues.
- Adjusted ex-TAC net income margin means adjusted net income margin divided by ex-TAC revenues.
These non-GAAP financial measures are used by management for evaluating financial performance as well as decision-making. Management believes that these metrics reflect the organic, core operating performance of the company, and therefore are useful to analysts and investors in providing supplemental information that helps them understand, model and forecast the evolution of our operating business.
In particular, we believe that it may be useful for investors and analysts to review certain measures both in accordance with US GAAP and net of the effect of TAC, which we view as comparable to sales commissions but, unlike sales commission, are not deducted from US GAAP revenues. By presenting revenue, adjusted EBITDA margin and adjusted net income margin net of TAC, we believe that investors and analysts are able to obtain a clearer picture of our business without the impact of the revenues we share with our partners. In addition, SBC is a significant expense item, and an important part of our compensation and incentive programs. However, as it is a non-cash charge, and highly dependent on our share price at the time of option grants, we believe that it is useful for investors and analysts to see certain financial measures net of the impact of these charges in order to obtain a clearly picture of our operating performance. Finally, as we hold significant assets in currencies other than our Russian ruble operating currency, and as foreign exchange fluctuations are outside of our operational control, we believe that it is useful to present adjusted net income and related margin measures net of these effects, in order to provide greater clarity regarding our operating performance.
Although our management uses these measures for operational decision making and considers these non-GAAP financial measures to be useful for analysts and investors, we recognize that there are a number of limitations related to such measures. In particular, it should be noted that several of these measures exclude some costs, particularly share-based compensation, that are recurring. In addition, the components of the costs that we exclude in our calculation of the measures described above may differ from the components that our peer companies exclude when they report their results of operations.
The tables at the end of this release provide detailed reconciliations of each non-GAAP financial measure we use to the most directly comparable US GAAP financial measure.


Contact:
Media Relations
Vladimir Isaev, Ochir Mandzhikov
Phone: +7 495 739-7000
E-mail: pr@yandex-team.com

 Download